
PrediHome is an interactive web app built using R and Shiny, designed to help users make informed decisions about the best province to live in Canada. The app provides detailed analytics on housing price data (HPI), unemployment rate, and employment rate data for the years 1986-2035. Users can input a specific year and receive insights and predictions about the HPI and employment metrics across different provinces.
The primary goal of PrediHome is to help users evaluate potential provinces to live in based on key economic and housing indicators. Users can:
- Explore historical data (1986-2022) and predicted data (2023-2035).
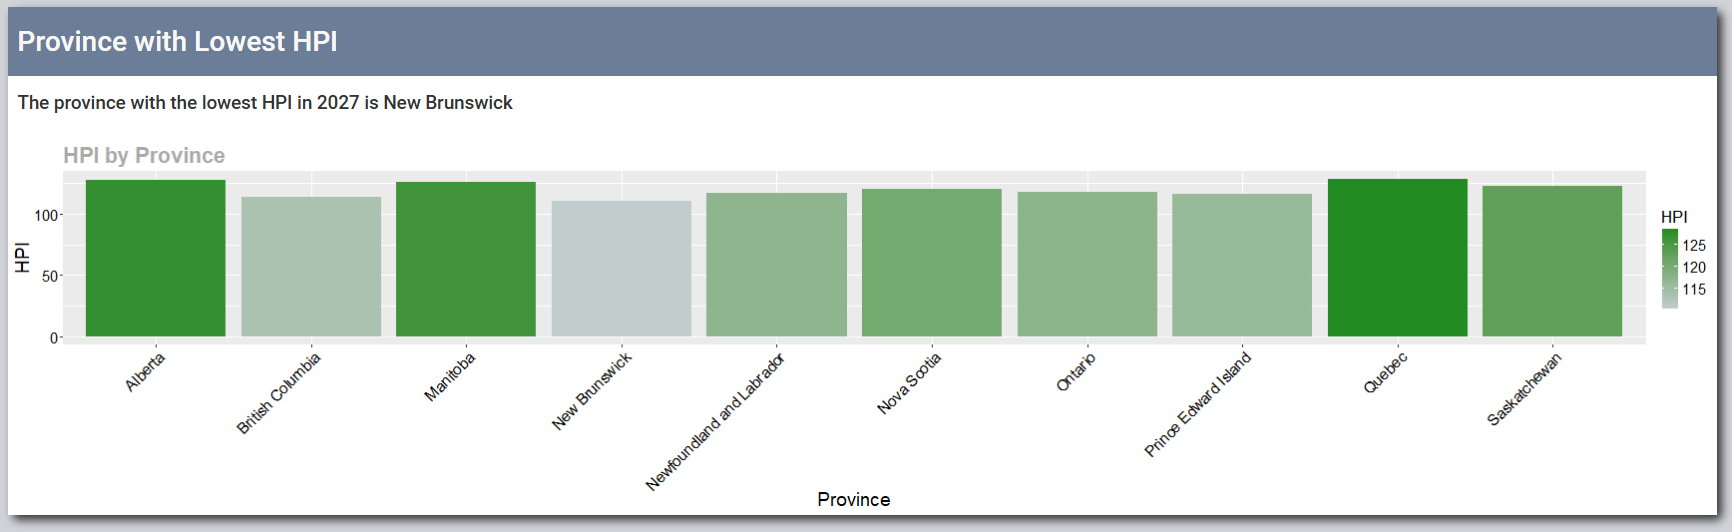
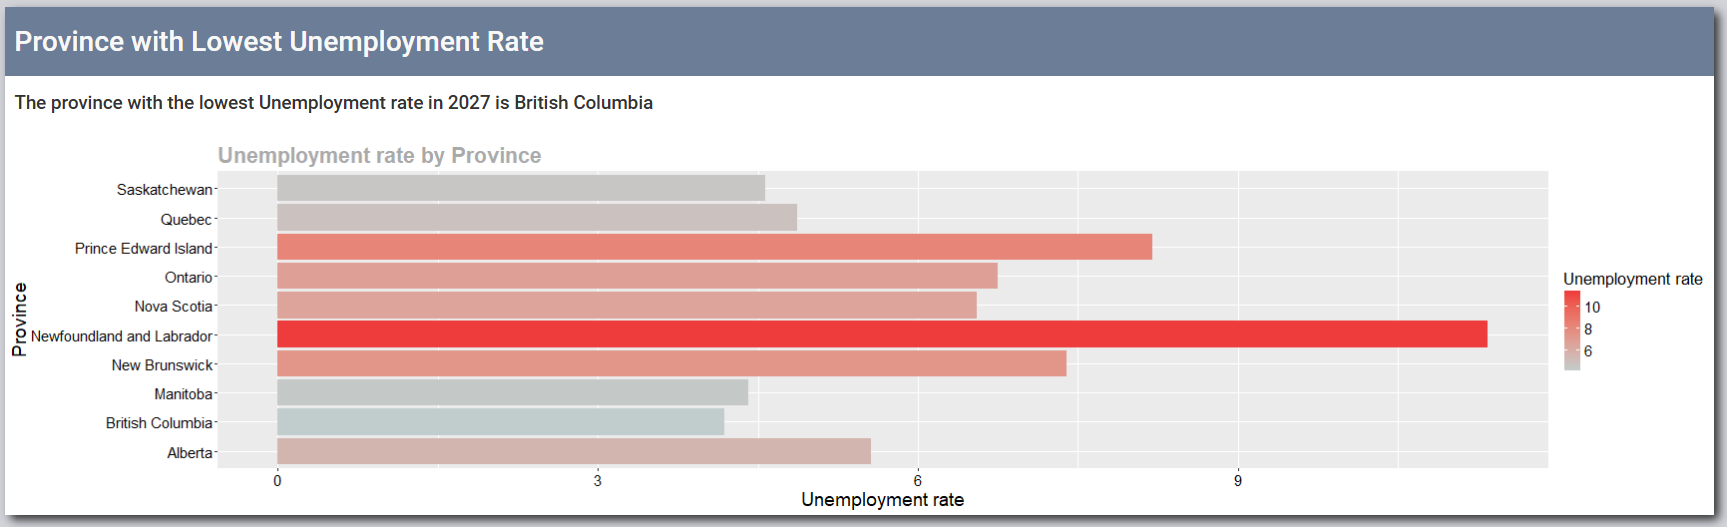
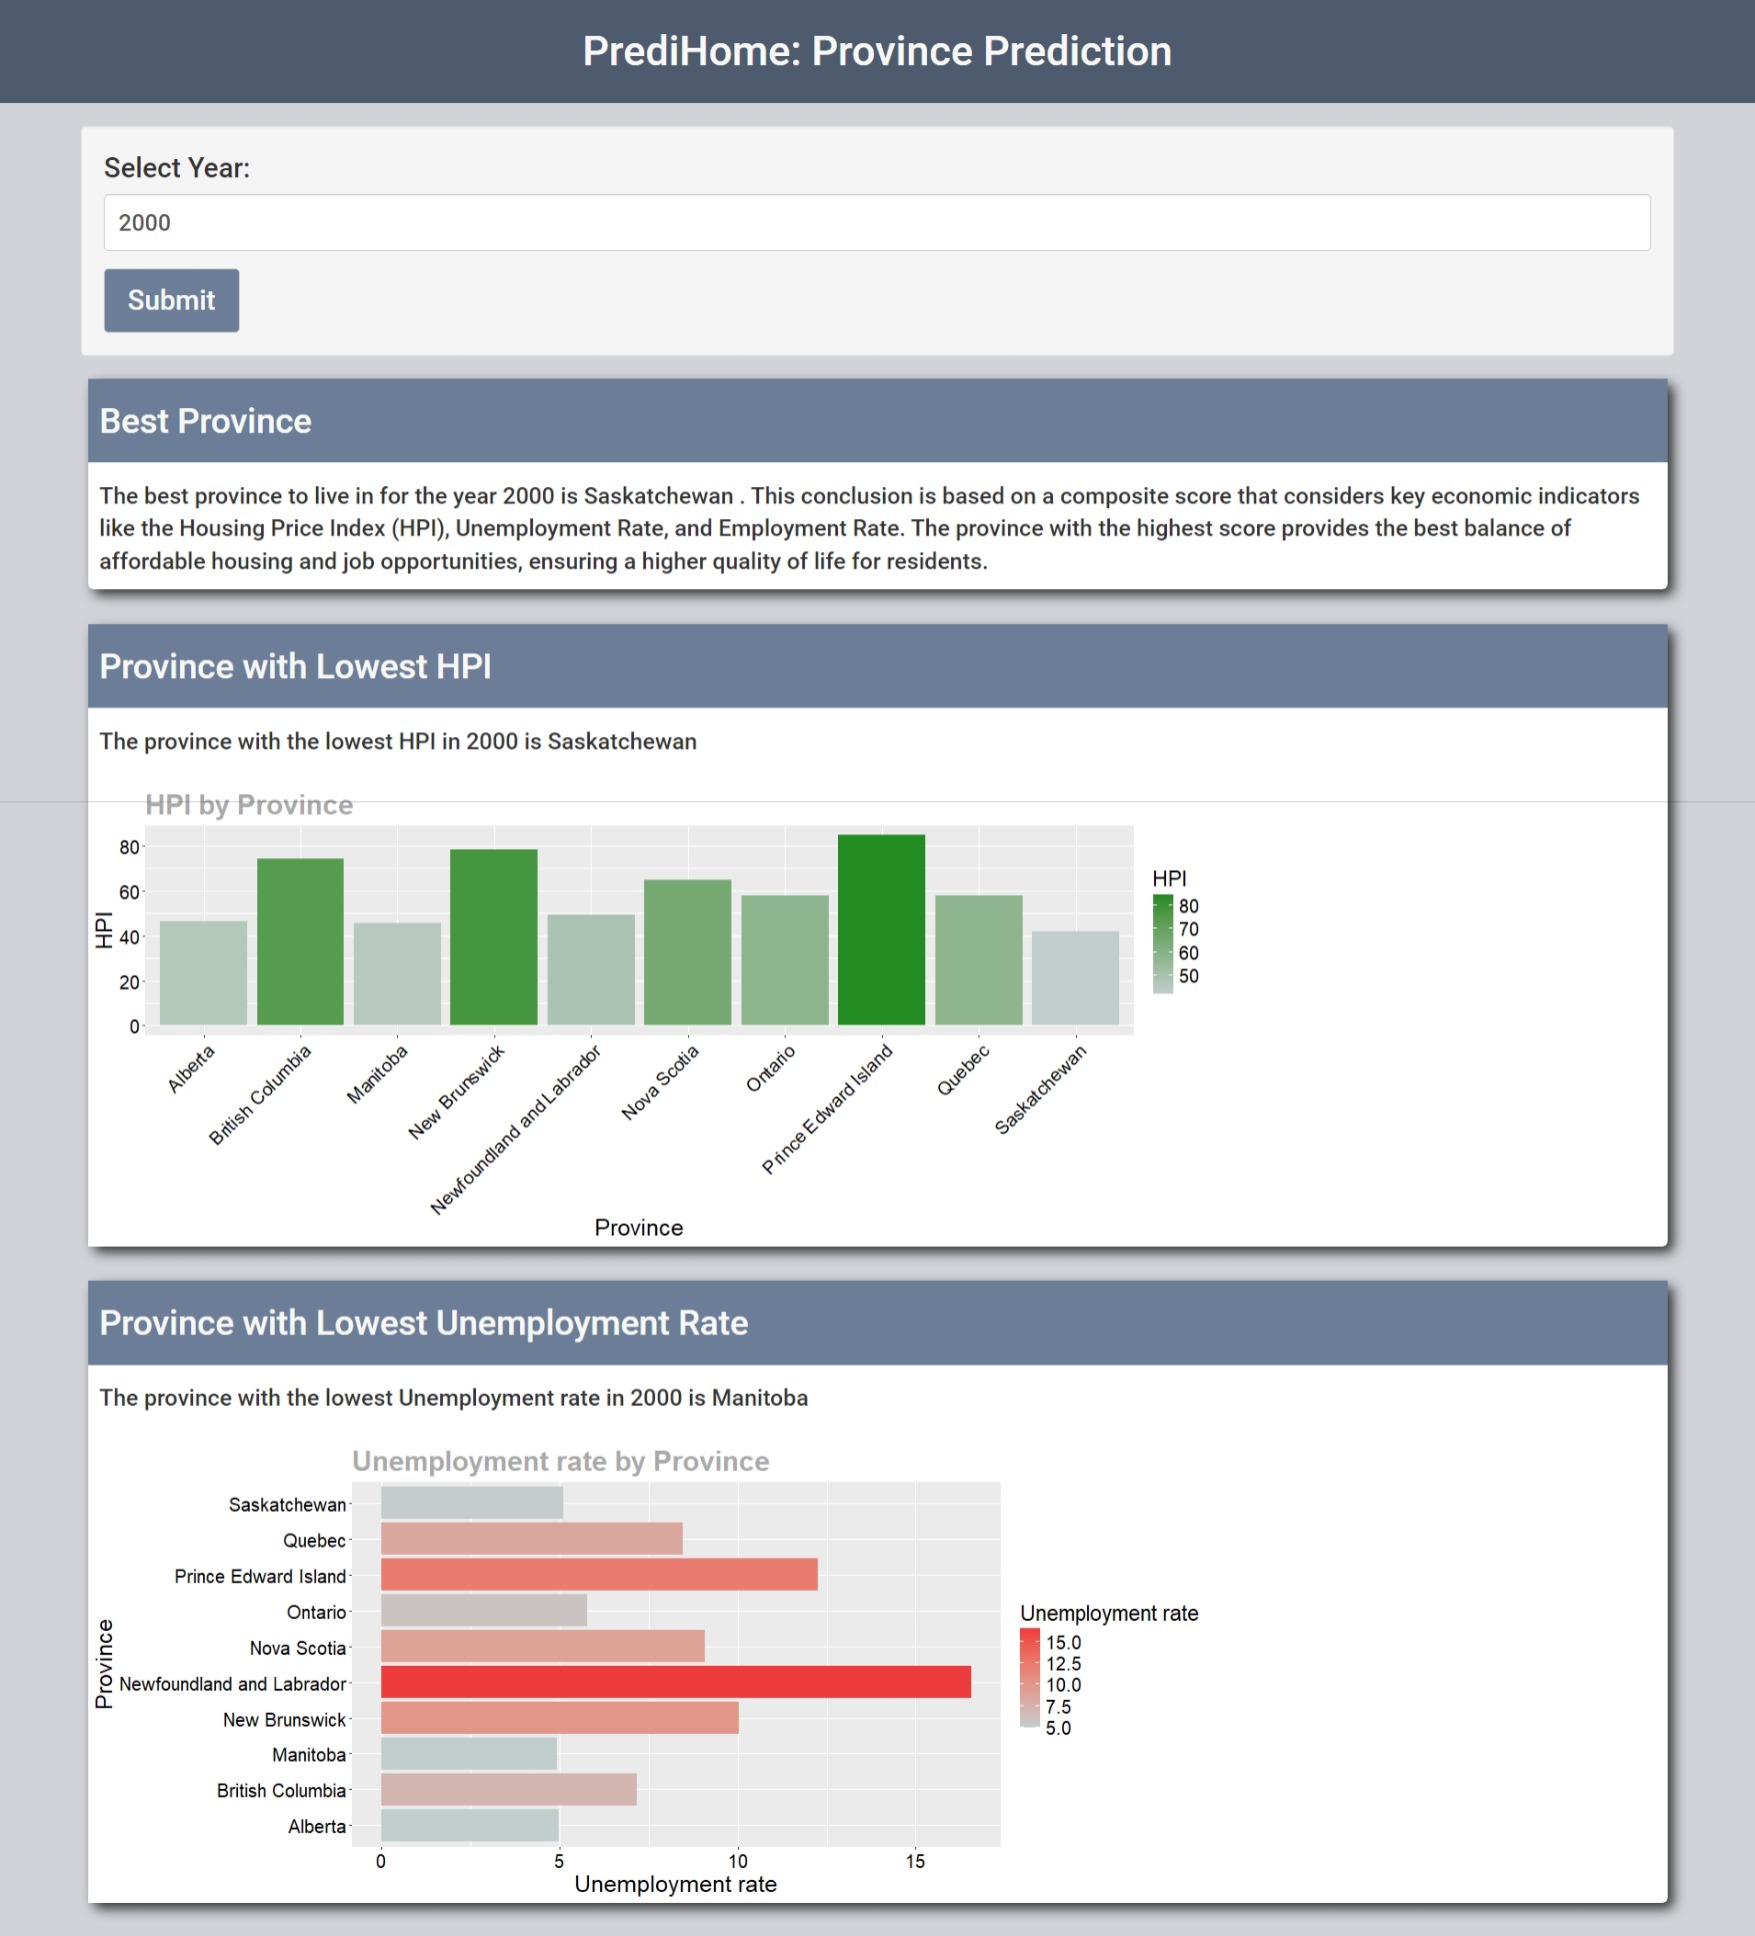
- View the province with the lowest Housing Price Index (HPI) and the province with the lowest unemployment rate.
- Visualize HPI and employment statistics for different provinces, assisting in comparing various factors that impact the cost of living.
-
User Input:
- Users select a year between 1986 and 2035 to analyze housing prices and employment statistics.
-
Data Analysis:
- The app identifies the lowest HPI province and lowest unemployment rate province using both historical data and predictive models (for the years 2023-2035).
-
Visualizations:
- Bar Chart: Displays the HPI values for each province in the selected year.
- Bar Chart: Shows the unemployment rate for each province in the selected year.
-
Regression Model Predictions (for years 2023-2035):
- Uses linear regression models to predict future HPI and unemployment rates based on historical data.
-
Identifies the best province to live in:
- Calculates a composite score for each province, where a higher score indicates a better province to live in. This is done based on the following metrics:
- Housing Price Index (HPI)
- Unemployment Rate
- Employment Rate
The analysis is based on the following datasets from Kaggle:
- Canada housing price data by regions 1981-2022: Contains data on the housing price index for each province in Canada between 1981 and 2022.
- Unemployment in Canada, by Province (1976-Present): Includes employment and unemployment rates for each province between 1976 and 2022.
- Cleaned and prepared the datasets by removing unnecessary columns and aggregating data at the province level for comparison.
- Historical Data (1986-2022): Analyzed trends in HPI and unemployment rates across provinces.
- Prediction for Future Years (2023-2035): Applied regression models to predict future values of HPI and unemployment rates.
The following visualizations help users understand and compare housing and employment metrics across provinces:
- A bar chart showing HPI values for each province in the selected year.
- Helps users visually compare housing prices and identify affordable or expensive provinces for that year.
- The bars have continuous color coding that reflects the HPI values.

- A bar chart displaying the unemployment rate for each province in the selected year.
- Helps users analyze the economic climate in different provinces and make informed decisions about employment opportunities.
- The bars have continuous color coding that reflects the unemployment rates.

PrediHome features a modern, easy-to-navigate user interface that includes:
- Numeric Input: Users can select a year between 1986 and 2035.
- Submit Button: After selecting the year, users can click the submit button to receive:
- The overall best province to live in.
- The province with the lowest HPI.
- The province with the lowest unemployment rate.
- Visualizations: A bar chart showing the HPI values of all provinces and one showing unemployment rates for all provinces.


- R: For data cleaning, manipulation, and analysis.
- Shiny: For building the interactive web application.
- ggplot2: For creating visualizations like bar charts.
- dplyr: For data manipulation and aggregation.
- tidyr: For tidying and reshaping the data.
- lm(): For building regression models to predict future data.
- Install the necessary R packages:
install.packages(c("shiny", "ggplot2", "dplyr", "tidyr"))
- Clone or download the repository.
- Open the R script and run the app.
- Enter a year (1986-2035) to view the analysis and predictions.
- Note: If you see an error that says “cannot open file ”: No such file or directory“, run
setwd("<path_to_working_directory>")in your terminal, replacing <path_to_working_directory> with the path to the directory containing the files you cloned.
-
- Name: Nafisah Nubah
- Email: nafisahnubah@gmail.com
-
- Name: Muhammad Rafat Hossain
- Email: rafat.click.hossain@gmail.com
 https://github.com/RafatH0ssain/PrediHome
Leave a Reply